Reports
Tessonics Corporation has made every effort to ensure the accuracy and completeness of this document; however, because ongoing efforts are made to continually improve the capabilities of our products, we cannot guarantee the accuracy of the contents of this document. We disclaim liability for errors, omissions, or future changes herein.
Tessonics Corporation and its subsidiaries reserve the right to make changes, corrections, enhancements, modifications and improvements to its products and/or to this document at any time without notice.
Information in this document supersedes and replaces information previously supplied in any prior versions of this document.
Tessonics and the Tessonics logo are trademarks of Tessonics Corporation.
All other trademarks mentioned herein are the property of their respective owners.
©2007–2024 Tessonics Corporation. All rights reserved.
No part of this document may be copied, reproduced, or translated, without the prior written consent of Tessonics Corporation.
TDS offers a variety of reporting tools to help get a better understanding of your part failures and reasons for them as well as operator usage
Part Failure Reports
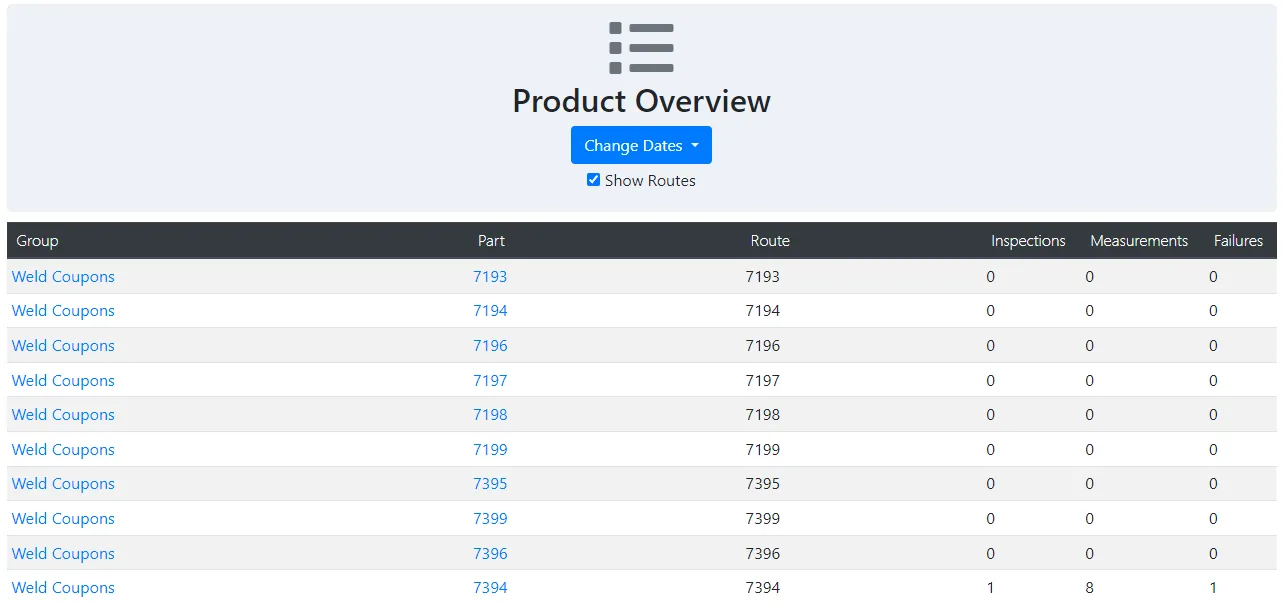
To view part failure reports, first head to the Product Overview report
page. You may also access the page via the Reports dropdown in the navbar by
clicking the Product Overview link listed there. This page lists the overall
inspection statistics for all Parts in every Group ever entered in the
database. These statistics include the total number of Inspections,
Measurements taken, and how many of them were Failures. The first entry will
always be for custom inspections made on the RSWA. Due to the nature of these
types of inspections, no further data can be provided. The Change Dates
dropdown may be used to lessen the timespan shown. To view the details for an
individual group, the Group names in the leftmost column may be clicked.
 {min-width=45%}
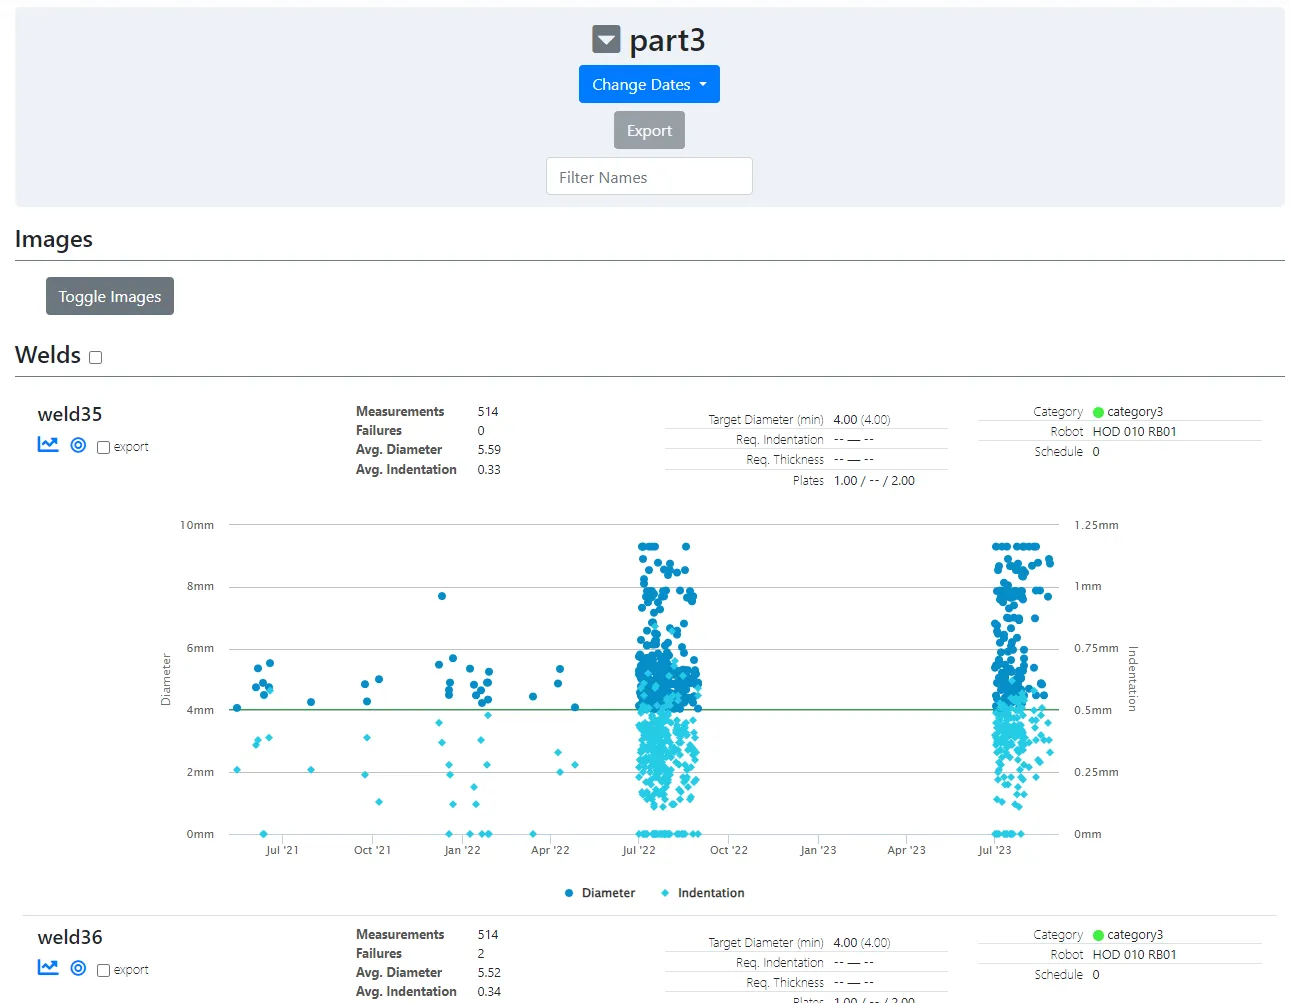
When a Part name is clicked, the details page for that part is opened. This is
very similar to the inspection details page for an inspection of that part. You
may use the Filter Names dialog to show only a subset of the joints in the
part. As before, the Change Dates dropdown may be used to lessen the timespan
shown. For each individual joint, next to the image viewer icon, there is a
report graph icon. Clicking this loads a graph plotting the data for each
measurement made in the given timespan. The remaining details are that of the
template parameters for the part as well as the Measurement and Failure
statistics.
 {min-width=45%}
Reason Usage Report
To view decision reason reports, first head to the Reason Usage report
page. You may also access the page via the Reports dropdown in the navbar by
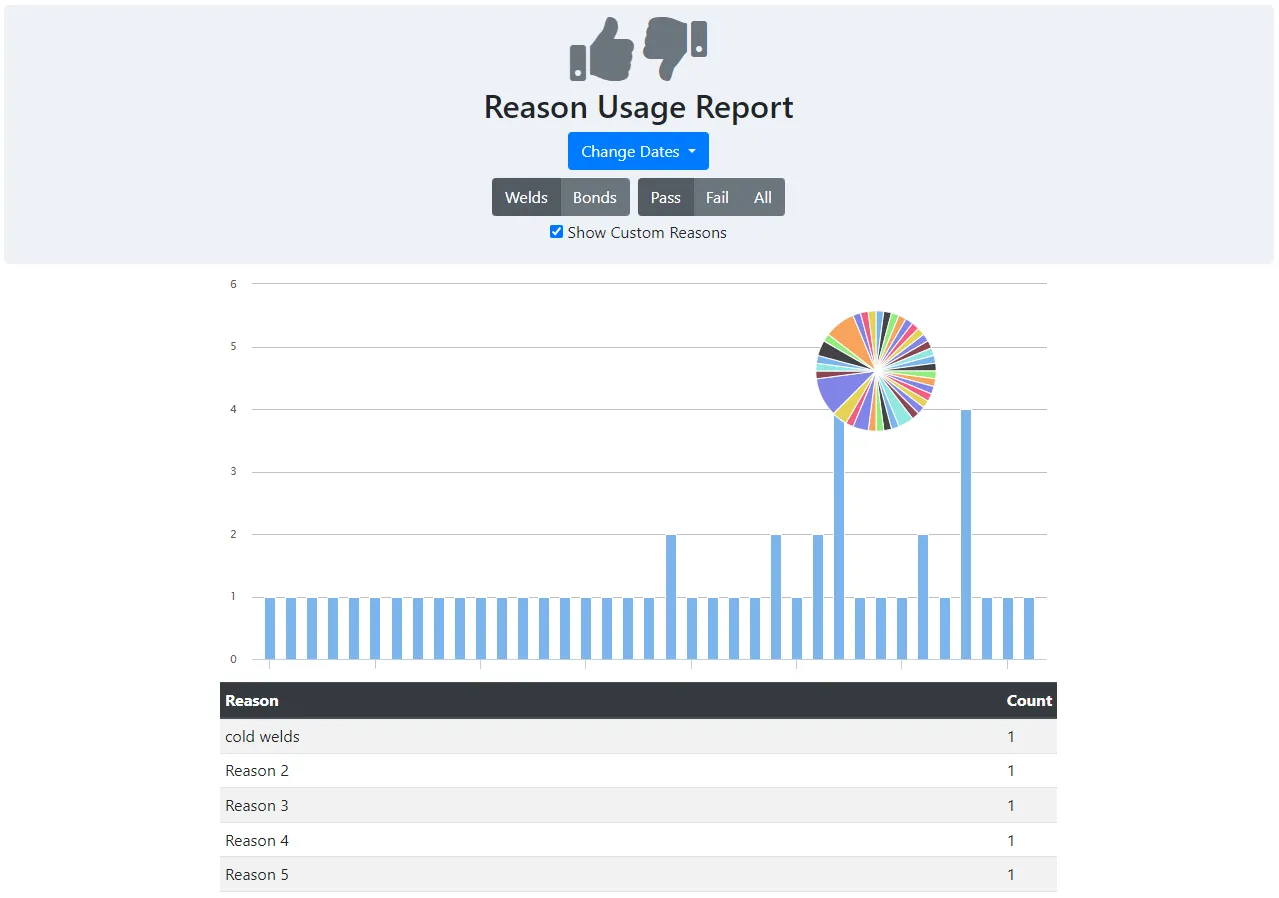
clicking the Reason Usage link listed there. This page lists reasons for
passing or failing a given measurement during an inspection. At the top of the
page, you will see filter options for modifying the results. You may change the
given date range, switch between viewing the reasons for Welds and Bonds, as
well as viewing Pass and Fail reasons, or both via the All option. The
Show Custom Reasons checkbox will change how reasons entered at inspection
time by the operator are displayed. If unchecked, they will be grouped together
under the ** Other Pass entry. Otherwise, there will be an entry for each
unique instance. You will be shown a bar graph and pie chart of the reason
counts and percentages for the given filters. Below that you will see the exact
count for each reason. Reasons that have been deleted from the data server will
appear as ** Deleted Pass or ** Deleted Fail.
 {min-width=45%}
User Usage Report
To view the work by various users, first head to the User Usage report
page. You may also access the page via the Reports dropdown in the navbar by
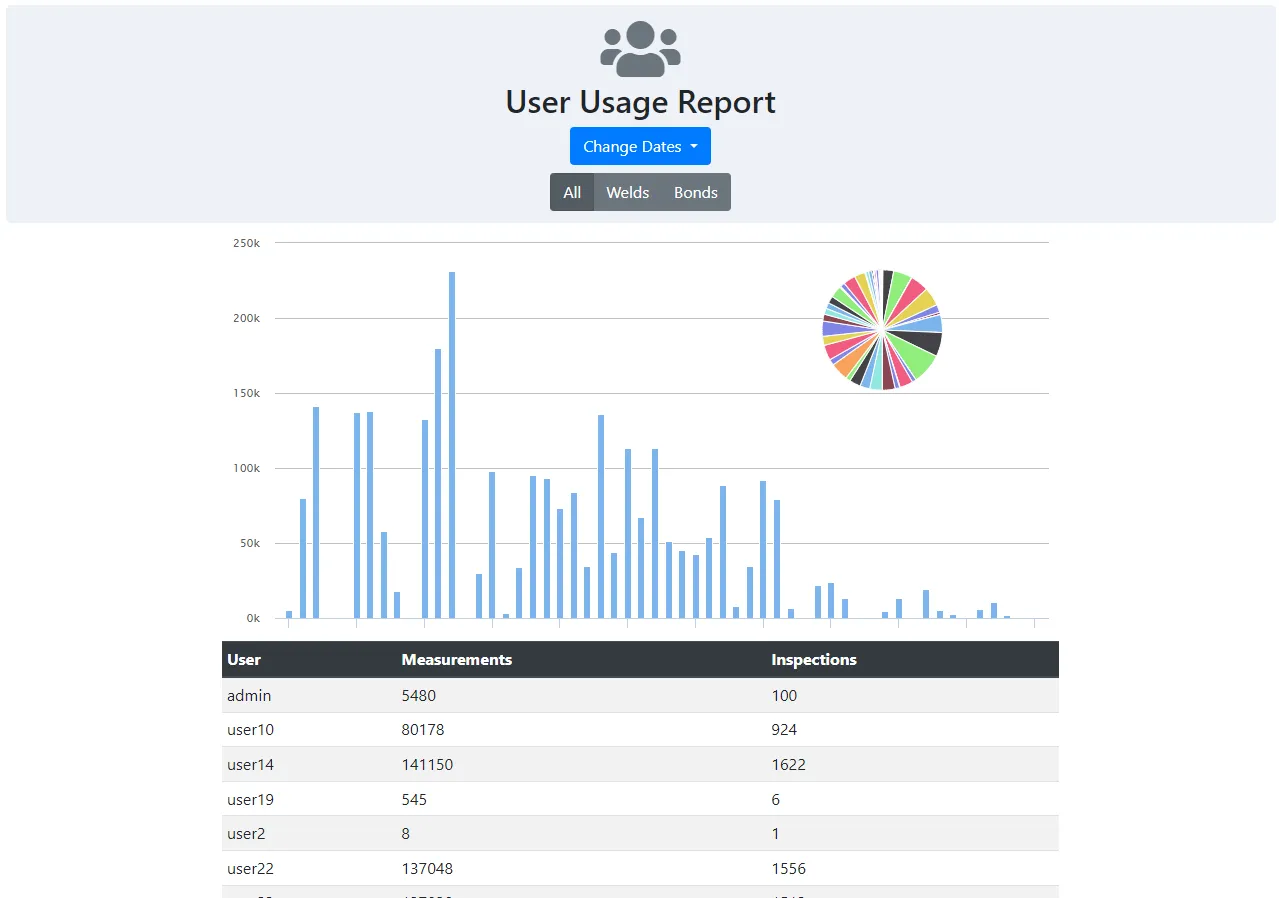
clicking the User Usage link listed there. This page lists the number of
inspections and measurements performed by all the different users. At the top
of the page, you will see filter options for modifying the results. You may
change the given date range, switch between viewing the report for Welds
and Bonds, or both via the All option. You will be shown a bar graph and
pie chart of the measurement counts and percentages for the given filters.
Below this graph, in the entry list, you can see the exact details for each user
in the data server. Clicking on their name will send you to the inspection list
with the current filters for that user.
 {min-width=45%}