Reporter
Tessonics Corporation has made every effort to ensure the accuracy and completeness of this document; however, because ongoing efforts are made to continually improve the capabilities of our products, we cannot guarantee the accuracy of the contents of this document. We disclaim liability for errors, omissions, or future changes herein.
Tessonics Corporation and its subsidiaries reserve the right to make changes, corrections, enhancements, modifications and improvements to its products and/or to this document at any time without notice.
Information in this document supersedes and replaces information previously supplied in any prior versions of this document.
Tessonics and the Tessonics logo are trademarks of Tessonics Corporation.
All other trademarks mentioned herein are the property of their respective owners.
©2007–2024 Tessonics Corporation. All rights reserved.
No part of this document may be copied, reproduced, or translated, without the prior written consent of Tessonics Corporation.
The Reporter allows a coordinator to review inspections and generate reports based on these inspections.
Home Page
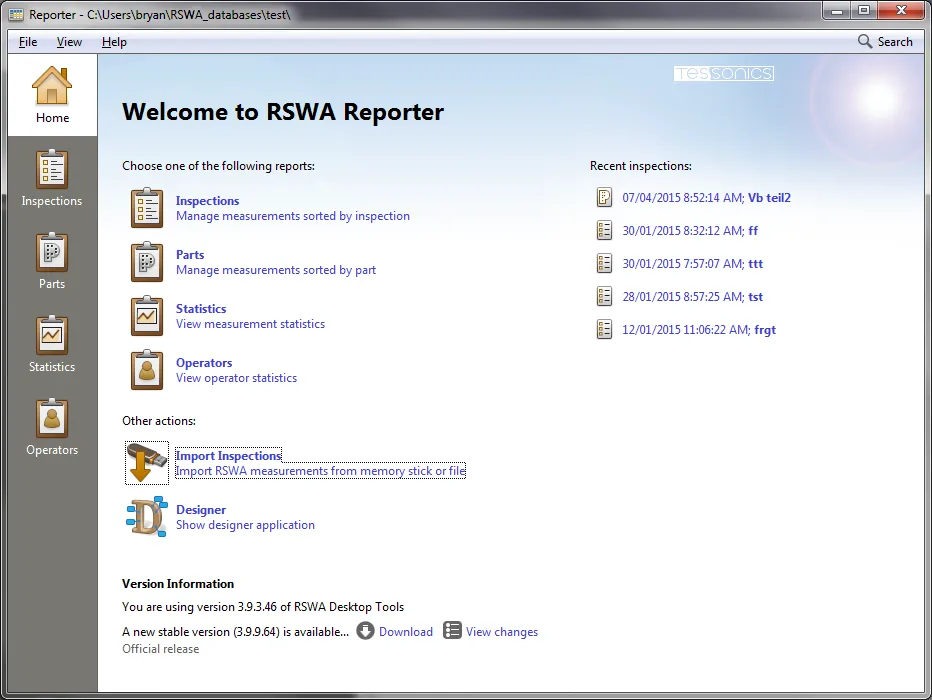
Home page is the first page you see after starting the reporter application.
 {min-width=45%}
The vertical list on the left hand side allows to navigate to different types of reports.
The main menu bar on top provides access to various functions, some options depend on the currently selected report.
The main content area contains quick links to the different types of reports, as well as links to recent inspections. There is also a link to import inspections, and a link to launch the designer application.
Specifying Database Location
To switch to a different location of the database, from main menu choose File→Database→Switch Location…
A new dialog box will open where you can specify the location of your database.
You will need to restart the reporter application to activate the new database location.
Importing Inspections
To import existing inspection files into the active database, from the main menu, choose File -> Import Inspections…
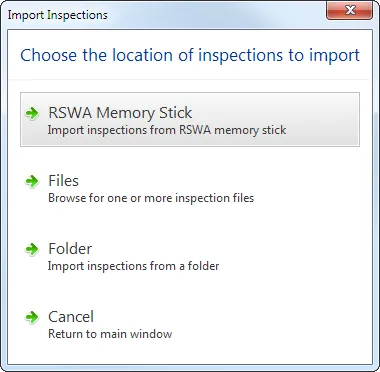
You will be asked to specify the type of import operation:
 {min-width=45%}
- RSWA Memory Stick
- Import inspections from RSWA synchronization memory stick
- Files
- Import inspections by choosing one or more rid files
- Folder
- Import all inspections from a specified folder
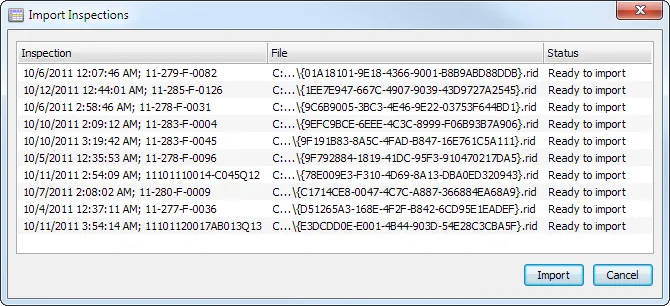
Upon choosing one of the options and selecting appropriate files or folders for import, the import dialog is shown below.
 {min-width=60%}
Here you can see the date of the inspection and the file name of the inspection that is being imported. Click the Import button to finish the import process.
Printing
Printing is supported for some of the reports.
Print Setup
To choose the printer and the paper size, from main menu select File -> Print Setup…
Modify the printer options and hit the OK button.
Page Setup
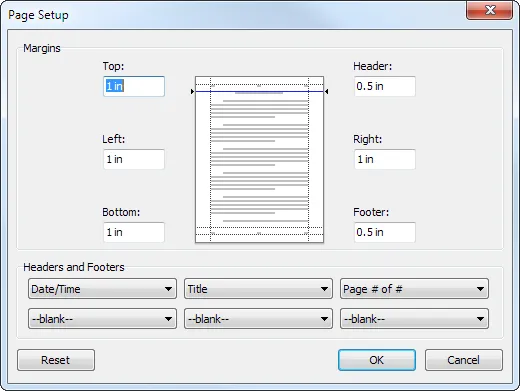
To setup page margins and the text for headers and footers, select File -> Page Setup…
 {min-width=45%}
Adjust the page margins and choose the text that appears in headers and footers, then hit the OK button.
To print the report, from main menu select File -> Print… (the print option may not be available for certain types of reports, it is also disabled if the current report view is empty or does not show any information for printing).
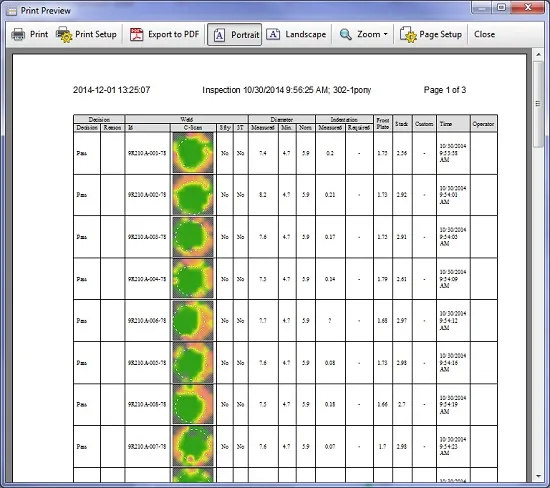 {min-width=45%}
The toolbar in the print preview dialog features the following options:
- Sent the pages to printer
- Print Setup
- Show the print setup dialog
- Export to PDF
- Save the report as a PDF file
- Portrait
- Switch the page to portrait orientations
- Landscape
- Switch the page to landscape orientation
- Zoom
- Change the size of the preview page
- Page Setup
- Show page setup dialog
- Close
- Close the preview window
Note
If the report does not fit in the printable area, try changing the page orientation to landscape. You can also hide certain columns in the report.Exporting
You can export the data from a current report in several formats.
HTML Export
To export your data as HTML page, from main menu choose File -> Export -> HTML…
Then choose the location for the generated HTML file and click OK.
If the exported data contains images, those will be exported in a separate directory alongside the main HTML file.
XML Export
To export your data as XML file, from main menu choose File -> Export -> XML…
Choose the location for the generated XML file. The file that is generated contains all the information that is relevant to the current report.
CSV Export
To export your data as comma-separated file, from main menu choose File -> Export -> CSV…
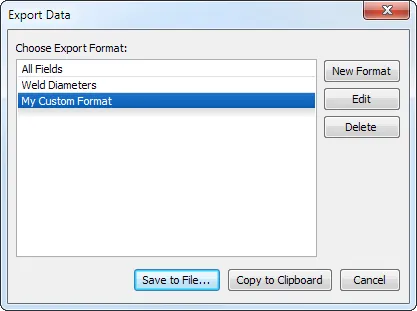 {min-width=45%}
Here you can choose a format of the data for export; then hit Save to File… to save the data to a file, or Copy to Clipboard… to save the data to clipboard that you can later paste in a spreadsheet application.
Export format allows to customize what columns should appear in the exported file. You can create new format by clicking New Format or modify existing format by clicking the Edit button.
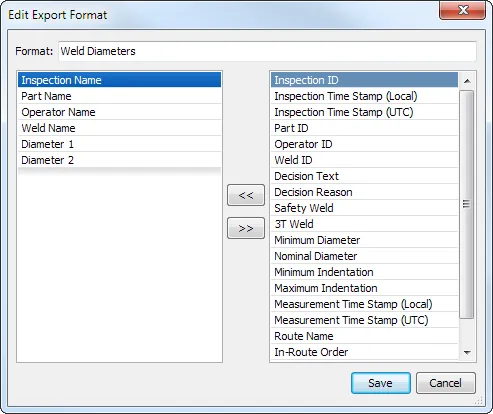 {min-width=45%}
The dialog box for creating or editing export formats has two columns. The column on the left contains the data columns to be exported, the column on the right contains the available data columns that are not exported. You can drag and drop the entries from one list to another and reorder the items with the mouse.
Searching
Reporter features a full-text search engine.
To start searching, hit F6 key or choose Search from the main menu.
A search window will pop up:
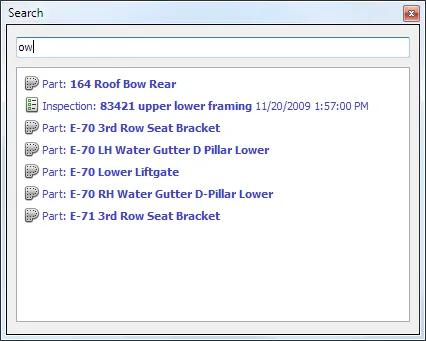 {height=40%}
Start entering the search phrase and the search results will automatically appear as you type. Most relevant results will appear first on the list.
Clicking on a search results will bring you to the corresponding report. Clicking anywhere outside of the search window will close it.
Inspections Report
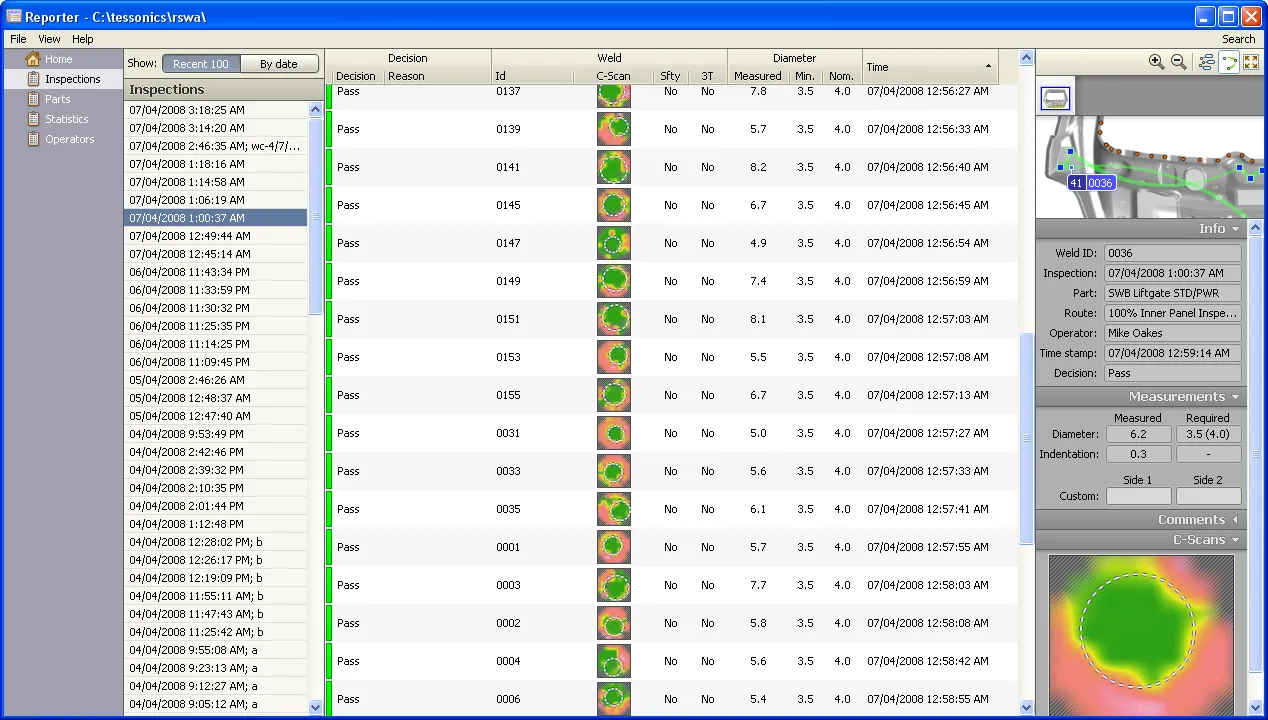
Inspections report shows measurements sorted by inspection (as illustrated below).
 {min-width=45%}
Inspection List
You can choose one or more inspections from the list on the left hand side of the screen. By default, it show recent 100 inspections. You can switch to calendar view by clicking the By date button. To choose more than one inspection for viewing, hold the Ctrl key and click on inspections you want to see.
Measurement List
All the welds belonging to the selected inspections are shown in the middle of the screen.
You can hide or show certain columns by choosing View -> Columns from the main menu, or by right clicking in the column header area.
You can sort the list by certain columns by clicking in the column header or by choosing View -> Sort by from the main menu.
Measurement Properties
The area on the right hand side of the screen show additional information on the selected measurement.
On the top, an image of the part is shown. Using the toolbar buttons you can zoom in/out, show/hide all labels, show/hide the measurement route, and zoom the image to full screen.
The Info section shows general measurement details.
The Measurements section shows the diameter and indentation. For reference, you can attach custom measurements obtained with other testing methods and place them into Custom measurement fields.
The Comments section allows entering custom comments.
The C-Scans section shows the detailed image of C-scans associated with the measurement.
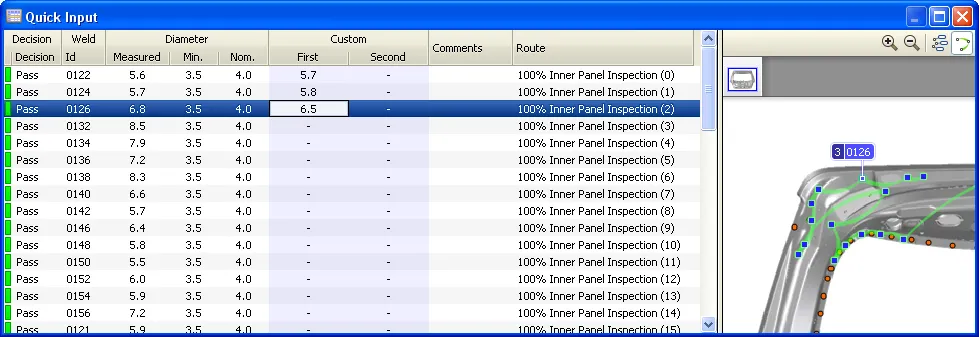
Quick Input
Quick Input mode makes it easier to input a large number of custom readings. To activate Quick Input, right click on the inspection and choose Quick Input from the popup menu.
 {min-width=45%}
Similar to the main inspection report, you can hide/show columns and change sorting order by right clicking in the column header area. You can type in directly into the Custom First and Custom Second fields as well as in the Comments field.
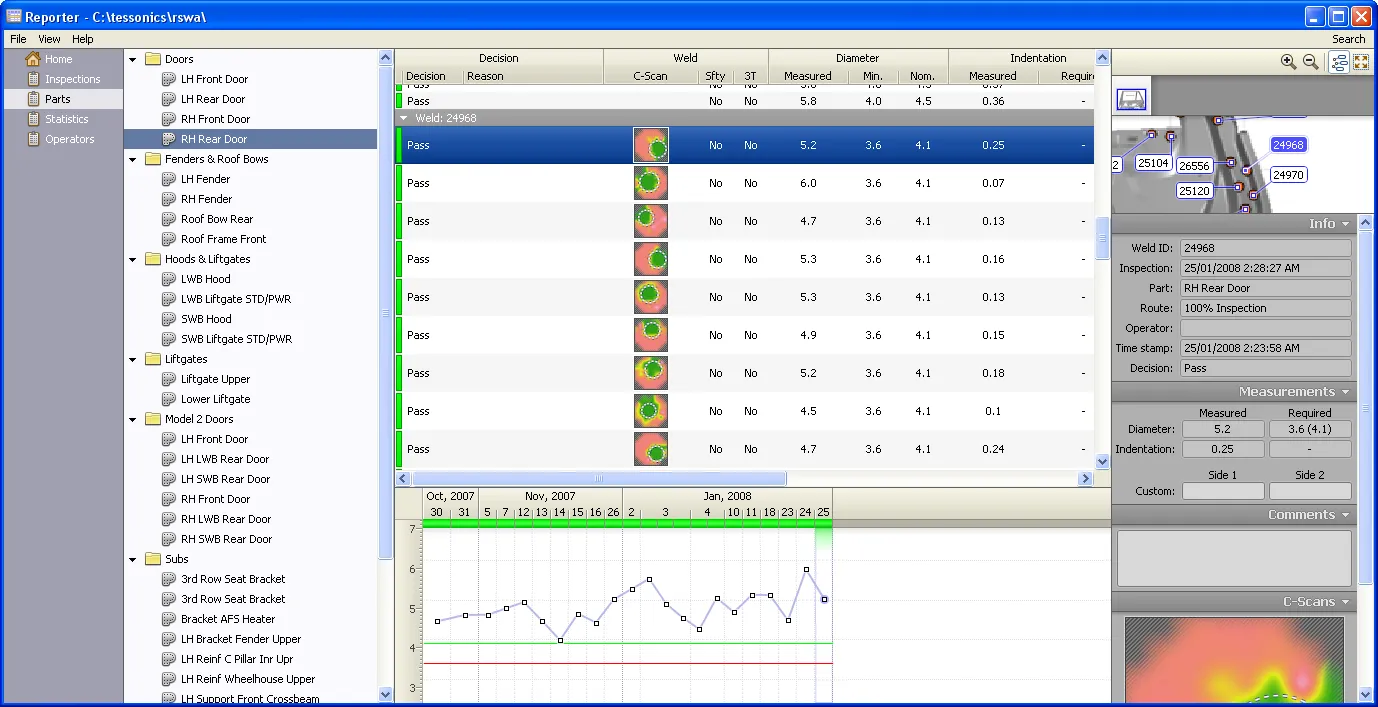
Parts Report
Parts report shows measurements filtered by part.
 {min-width=45%}
Part List
A list of parts is shown on the left side of the report.
Weld/Measurement List
The main area of the screen shows welds that belong to a currently selected part. Each weld is shown as an expandable section. Click on a small arrow next to a weld name to expand it and to see all associated measurements.
History Graph
History graph is located at the bottom of the report. From this graph you can quickly see the historical data on the selected weld. The blue line on the graph corresponds to the estimated diameter of the weld, red and green lines show minimum/nominal reference diameters at the time the measurement was taken.